-
Language
- sitemap
- sitepolicy
QCD
Home / QCD
QCD
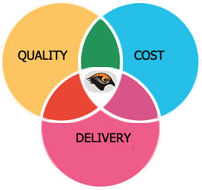
Control on Quality, Cost, Scope, Delivery and Schedule with Intelligent Alerts.

QUALITY
- Defect summary and defect fixing trend graph
- Issue summary and trend graph
- Trend graph provides an overview for controlling the quality. It also shows future prediction for taking timely corrective action as well as giving an indication as to whether recovery plan is successful or not
- Risk status for reviewing the risk and level up or down as per the situation
- Change request summary and status
COST
- Displays estimated efforts, planned efforts and actual efforts spent till date
- Segregation of actual efforts to identify the Project Manager’s planning and the performance of the team
- Efforts planned and spent on change requests.
- Prediction of the cost overrun
- CPI trend graph indicates whether project cost (efforts) is undercontrol
- CPI trend graph also identifies the gap between planned and actual efforts and the reason for the gap
- Resource allocation gives quick overview of designation-wise resource distribution
- Resource allocation graph helps identify the gap between resource allocation and utilization
- It also helps know about when and how many resources are idle or under/over utilized
DELIVERY
- Indicates Percent Completion status of a project
- Planned Dates Vs Actual Dates Graph
- SPI trend graph reveals delay or lead in days, a crucial information for Project Managers
- Milestone summary is used to track delivery timeline and status
Copyright © 2008 - 2016 Sutra Systems Co. Ltd. All rights reserved.