-
Language
- sitemap
- sitepolicy
All in one Project Management Software
Features
Enterprise Project Monitoring And Controls
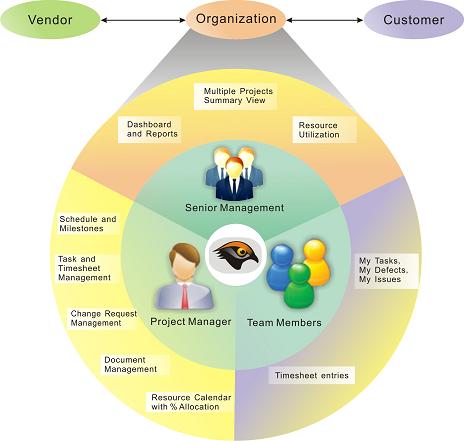
- Manage multi location projects.
- Role based access rights and views.
- E-mail notification on set trigger events.
- 80+ Alerts for pre-defined measures.
- Scope Management, In-built Scheduler
- File Import Export support for MS-Project and MS-Excel.
- EVM, Cost Budget, Planning and Tracking.
- Resource and Material Management.
- Open source based cost effective solution.
- Interface to other legacy systems using Connector.
- Business Intelligence using “HawkEye Analytics”.
* MS-Project& MS-Excel are products of Microsoft Corp.
Dashboard – A Bird’s-eye View
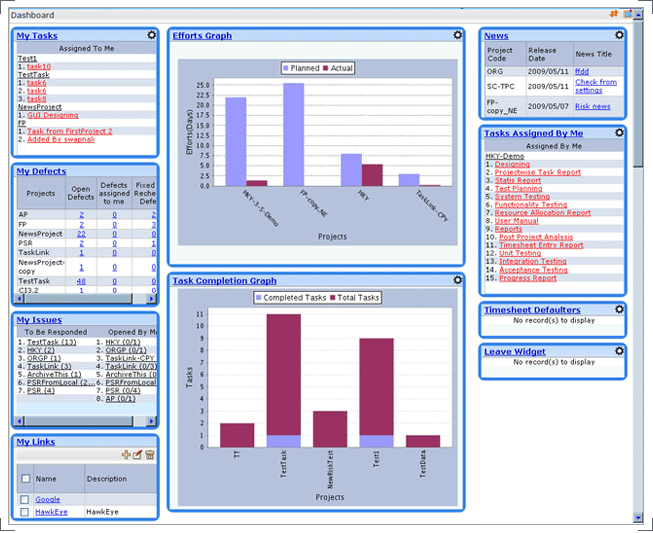
Dashboard provides a summary of multiple projects.
According to the access rights of the resource, the following widgets are displayed.
- Efforts graph
- Task completion graph
- Defects graph
- My Tasks
- My Issues
- My Defects
- Updated documents
Dashboard also provides
- Configurable layout and widgets
- Customized filter for Department, Project, Category and Timeline
- Custom external links
On the dashboard, details according to the rights or role of the resource are displayed.
Moreover, although the role is the same (e.g., a leader, a tester, etc.), the manager can customize the details for each employee.
Reports
Various reports are available in Hawkeye.
Reports(QCD)
- Provides a status of the project at a glance.
- Summarizes estimated, planned and actual percent complete of the project. Also summarizes status of Tasks, Issues, Defects and Milestones.
- Provides detailed reports such as CPI and SPI trend and efforts trend.
- Can be downloaded in Microsoft Excel format.
- Can be mailed to the selected resources on the specified day.
- Issue Graph
- Defect Graph
- Project Completion Trend Graph
- Efforts Trend Graph
- CPI and SPI Trends
- Milestone Status
Earned Value Management
Project % Complete is calculated based on Earned Value Management.
Information about whether Project is leading or lagging is readily available.
- CPI = 1.0 i.e. Project cost is within budget
- CPI > 1.0 i.e. Project cost is below budget
- CPI < 1.0 i.e. Project cost has exceeded budget
- SPI = 1.0 i.e. Project is on schedule
- SPI > 1.0 i.e. Project is ahead of schedule
- SPI < 1.0 i.e. Project is behind schedule
- SPI = 1.0 i.e. Project efforts are as per budget
- EPI > 1.0 i.e. Project efforts are less than budgeted
- EPI < 1.0 i.e. Project efforts have exceeded budget
Progress Status Report
- Create a snapshot of the project status and summary till a particular date.
- Report can be used as monthly/weekly status reporting by leaders.
- Leaders can report their own views, problems and Corrective Measures along with actual data.
- Report creators can create reports for the modules/functionality for which they are in-charge or as per access rights.
- Reports can be customized by configuring custom fields.
- Leaders can specify their understanding of status and comments for deviations. This info also gets saved along with report
- The generated report can be accessed from list.
- Senior management can give their feedback or comments on the generated reports. These comments can also be saved or emailed to report creators.
- The reports can be downloaded in excel format.
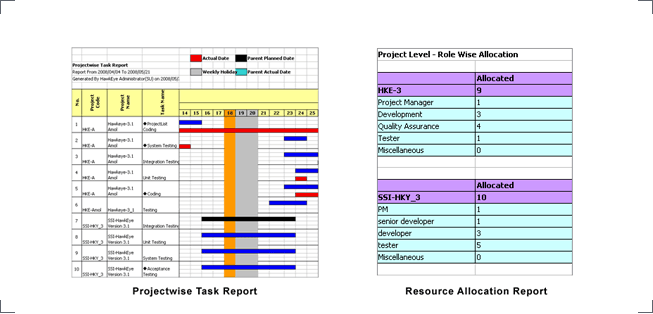
Projectwise Task Report
Project-wise trask report gives an overview of project-wise distribution of tasks in each stage.This report contains complete information about the searched tasks. Optionally, a Gantt chart showing task dates graphically can also be displayed. There are multiple sheets in Microsoft Excel report.
This report can be customized using three different parameters such as Select Criteria, Gantt Zoom Selection and Report Column Selection.
This report gives efforts summary of Assigned Tasks, Unassigned Tasks, and Task Type-wise Efforts
Resource Allocation Report
Resource Allocation Report gives complete information regarding allocation of all resources in each project.When Start Date and End Date are not specified in the Search Criteria, data gets displayed for the previous month and up to the three subsequent months from the current month.
Values, which are not within the specified limits, are displayed in Red color. E.g., if the value of planned efforts per day is greater than the value of working hours per day, the value will be displayed in Red colour.
Timesheet Entry Report
This report gives detailed report regarding timesheet entries made over selected amount of time by selected resources in a selected department (including the sub-departments)Process Management
Quality Assurance(Auditing)
Quality assurance attempts to improve or stabilize production and associated process to avoid or at least minimize issues that lead to the defects.
Quality Assurance module keeps track of Audit life cycle and workflow. Auditors can plan audits, and record audit findings generated during Quality Audit.
- Periodic Audits or Project Phase based Audits are defined in process management module.
- As per the Quality Standard (ISO / CMMi) followed by the organization, clauses can be configured in HawkEye.
- Auditors can link audit findings to ISO clauses or CMMi processes.
- Project team takes corrective or preventive actions as an implementation of audit findings (Non conformances or observations).
- Auditors recheck and close the audit findings using audit report.
- HawkEye maintains history for each step of finding and action implementation.
Project Template
Various project templates are available as per the different types of details required for tracking different projects.Templates can be configured as per the business unit requirement.
Life Cycle Management
Various Phases, Inputs, Outputs and Activities can be defined in the Life Cycle Management.Approval workflow available, and change history is maintained.
Project Management Plan
Project Management Plan provides guideline for- ●Scope planning, escalation.
- ●Process tailoring, requirement change management, estimation basis, training plan.
- ●Quality goals, test planning.
- ●Schedule tracking, issue tracking, status reporting
Post Project Analysis
Post Project Analysis can be used to check and report the project performance for Quality, Cost and Delivery after the end of project.Best practices and lessons learnt can be noted down here.
●Goals
- Quality Goals
- Cost Goals
- Delivery Goals
- Customer Feedback
- Lessons Learnt
- Process Improvement Recommendations
Functionality (Scope Management)
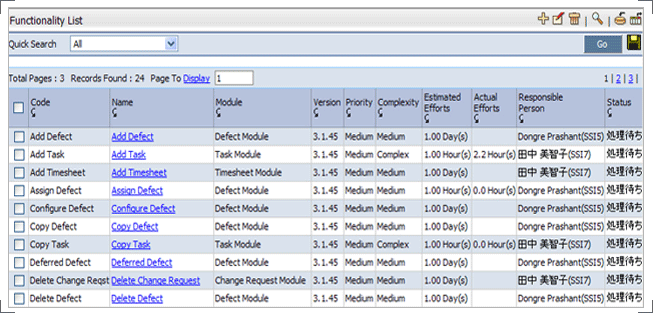
Functionality facilitates management of requirements of any project at central place, therefore different team members can refer to the latest version of requirements easily.
- It also allows linking with Tasks, Issues and Defects thereby providing complete status tracking of any requirement quickly. Priority, complexity can be set to each requirement.
- Priority, complexity can be set to each requirement.
- Unique identification code can be assigned to each requirement.
- While adding the functionalities, estimated efforts can be defined.
Resource Management
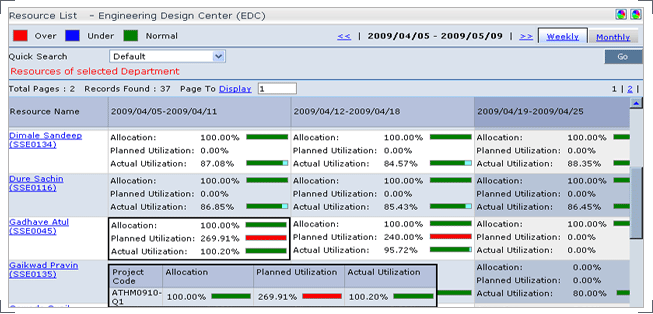
Allocation and utilization can be viewed on Weekly and Monthly basis.
Different color schemes are used to denote under-allocated, properly allocated & over-allocated resources.
Resource list will be displayed according to the user access rights.
By using the Quick Search option, user can search the specific resource in the list.
- Allocation shows the percentage of allocation of a resource over multiple projects.
- It helps identify whether a particular resource is available for a certain project.
- Different color schemes are used to denote under-allocation, normal allocation and over-allocation of a resource.
- Resource calendar is displayed with planned efforts and actual efforts.
- Planned and Actual utilization of a resource over multiple projects is displayed.
- Actual utilization shows the percentage of actual utilization of a resource over multiple projects.
- The display shows under-utilization, normal utilization, and over-utilization of a particular resource.
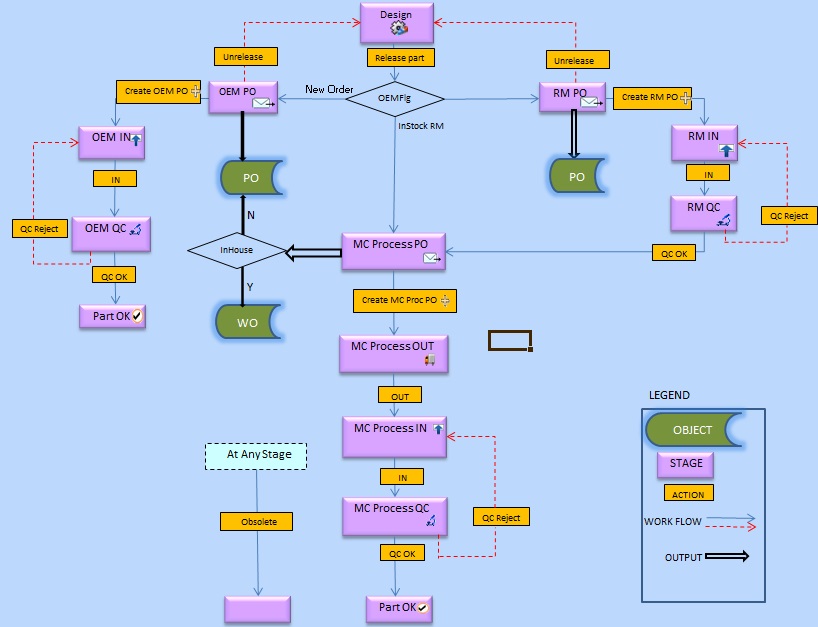
BOM Management
A system that monitors the LifeCycle status of each Part/Assembly in the BOMLifecycle of each part typically consists of Design, Purchase and Manufacturing
Quality Checks can also be done at each Stage
Purchase Order Generation and Invoice tracking enables understanding of overall cashflow
Assembly wise Cost can be captured
Overall WorkFlow can be customized as per client requirements
OutSource Management
OutSource:Resource Management
- A system that monitors resource-wise and project-wise allocation or utilization.
- Allocation and utilization can be viewed on Weekly and Monthly basis.
- Different color schemes are used to denote under-allocated, properly allocated & over-allocated resources.
- Resource list will be displayed according to the user access rights.
- By using the Quick Search option, user can search the specific resource in the list.
- Allocation shows the percentage of allocation of a resource over multiple projects.
- It helps identify whether a particular resource is available for a certain project.
- Resource calendar is displayed with planned efforts and actual efforts.
- Planned and Actual utilization of a resource over multiple projects is displayed.
OutSource:Material Management
Material required in the project defined in the Control Panel and inherited into the project.
Information about Material consumption as the project progresses is available.
- Define cost or rate per unit for Material
- Projects can use material along with the human resources
- History of the changes made in the material cost also recorded
- In various calculations, the material rates used, shall be as per effective from date
- Provision to add / edit backdated cost or rate of each material
- Usage / consumption of material in the project and automatic calculation of material cost in the Project.
Training Management
Identification, planning, and reporting the training feedback and evaluation.
- Training programs are identified and added in the “Training Plan” and displayed in the “Training List”.
- Training program is linked with Tasks for monitoring the actual dates and efforts spent as against the planned.
- Trainer and Trainees are added to the training program.
- The Trainees report the training Feedback.
- Status of Training program can be updated as “Planned”, “In Training”, “Complete” and “Cancelled”.
- Quick Search feature is provided for searching a particular training in the list.
- Using Training Configuration, different types of training can be added e.g. Technical, Management, Language, etc.
Review Management
Recording the review comments, during the various phases of project life cycle, for bringing the visibility about quality.
- Reviews planned in project have status such as “Planned”, “WIP”, “Approved / Rejected”, “Completed”.
- Review Plan is linked with Tasks for monitoring the actual dates and efforts spent as against the planned and graphs displayed.
- Outcome of review is reported under Review Findings.
- Status of Review Findings is “Open”, “Fixed”, “Verified”.
- Review Findings Summary is also reported under “Progress Status Report”.
- Import and Quick Search is available for Review Plan.
- E-mail notification when review is initiated and review is completed.
Risk Management
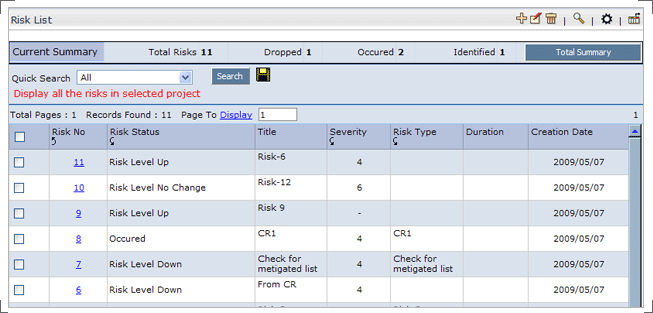
The events or circumstances inside or outside the project that can affect the success of the project are called Risks.
- Risk can be Identified – Intensity change in level – Occurred – Dropped using the RISK module.
- With the help of risk details and Mitigation plan status, status of the risk can be easily identified.
The stages in the life cycle of a risk are as follows:
Risk identification -> Risk assessment -> Mitigation plan definition -> Risk occurrence -> Implementation of mitigation plan -> Closure
- An identified risk that is no longer perceived to be a risk for a project can be dropped from the project.
- A risk that has occurred cannot be dropped.
The severity of the risk is calculated automatically. It is the combination of the impact and probability of the risk.
- While adding the risk, the risk mitigation plan can also be added.
- This plan is the corrective or the preventive measure to avoid the risk or reduce its impact in order to make the project successful.
Inbuilt Scheduler
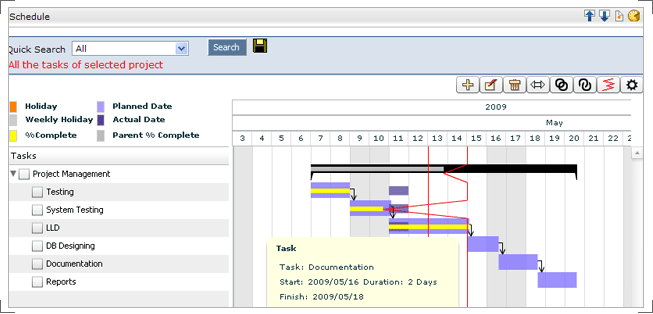
This is scheduling component of HawkEye.
Work Breakdown Structure can be imported using interfaces created for Microsoft Excel and Microsoft Project.
For rescheduling a Browser based Flash tool has been incorporated.
- Task Add, Edit, and Delete
- Microsoft Excel and Microsoft Project Interface
- Gantt View and download/li>
- Rescheduling Interface (Link, Unlink, Move)
- Kaminari Sen (Trend Line)
- Resource Allocation Graph
Milestone
Milestone is used as a project checkpoint to validate how the project is progressing and what measures should be taken for further plan | progress of the work.
Timesheet
- Timesheet module allows user to capture information of actual efforts spent in the day.
- Timesheet Entry can be done against assigned Tasks, Issues, and Defects.
- Timesheet entries can be done for planned as well as unplanned work performed.
- Multiple Timesheet Entries can be done in one shot to save the time.
- Quick view of daily and weekly timesheet entries is available.
- Allows importing of multiple Timesheet entries of Tasks for any user.
- Timesheet can be exported, and printed as per the user requirement.
- Timesheet Entry Reports can be generated at Individual, Project or Department level. Result can be filtered by selecting search criteria based on Project Code, Project Name, Resource Name and Work Date from Resource Module.
- Displayed columns are also configurable.
Issues Management
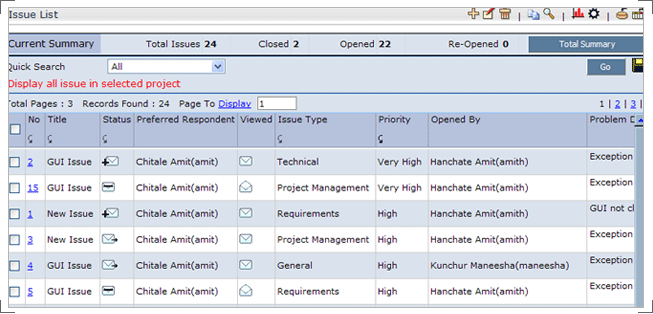
This is a Communication Management tool that tracks queries along with the responses and conclusions.
This communication could be between the project members or even customer and support members.
- Issue Add, Edit, Delete, Close, and Reopen
- Excel interface for Import & Export
- Issue Analysis tool (Summary Report)
- Issue Graphs
- Custom Fields
Test Management (Quality Control)
Quality Control emphasizes testing of product / project to uncover defects, and reporting the same to management, in order to allow or deny release or delivery.
- Recording the test scenarios | cases, and test results giving the visibility of test coverage.
- Quality Control contains following
- Test Suite
- Test Cycle
- Test Runs
- Test Suite is a collection of test cases that are intended to be used to test product / programme / system to show that it has some specific set of behaviors.
- Testing scope in terms of workload or functionality is defined under Test Cycle, and actual dates and efforts are monitored against planned.
- Test Result of Test Suite and Test Cycle is reported under Test Run, with linking of defects, tasks, and resources.
Defects Management
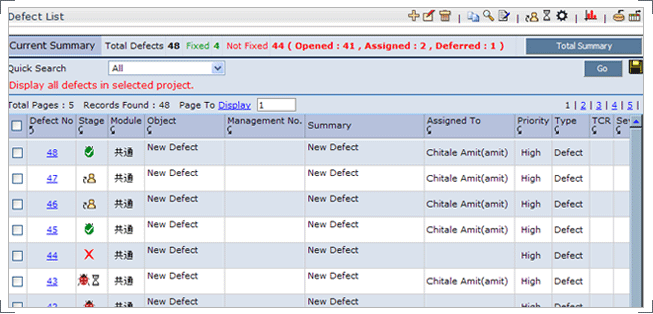
Quality management forms an integral part of every project management software.
- Defect Add, Edit, and Delete
- Excel interface for Import & Export
- Customizable Defect Workflow
- Values for fields like Defect types, categories, and phases can be customized
- Custom Fields
- Defect Analysis tool (Summary Report)
- Defect Graphs
- Alerts
Document Management
Users can share files and collaborate with clients, vendors and employees over Internet.
Provides following features
- Versioning
- Locking
- Multiple attachments
- Hierarchical folders (tree structure) and
- Document search
Files can also be attached from features such as, Functionality, Task, Issue, Defect, Change Request, and Risk and shared with other project resources.
Provides document-locking facility to protect them from deletion or modification by other users.
Keywords can be entered for easier search.
Change Request Management
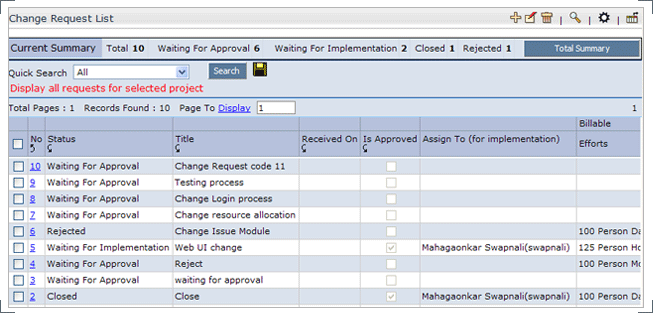
Change Request feature in HawkEye helps easy identification, documentation, tracking and closure of changes in a project.
Provides detailed information with efforts analysis on changes, thus saving manager’s time.
Tasks can be generated or linked to the change request and the estimated and actual efforts can be tracked for each change.
Risks can be identified or the existing risk can be linked to the Change Request, thus representing the impact on quality, cost and delivery of the project or module.
By viewing realtime data, impact of change across the entire project can be assessed.
Status change is notified through email.
Cost Management
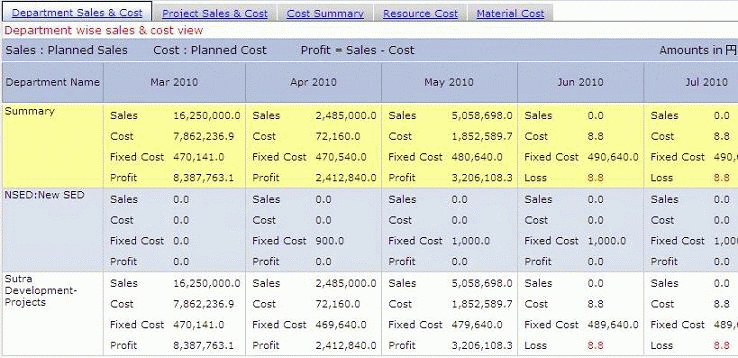
Category wise summary information of project costs readily available.
- Monitor and analyze various project costs like resource, material, expenses etc.
- Summary of all cost categories against budgeted, planned, actual values.
- Know profit values or remaining budget in each cost categories
- Status of review approve of all cost heads are displayed.
- Manage actual expenses or cost incurred in project.
- Review approval history for every cost type available.
- Detailed category wise cost analysis report with cost predictions downloadable in MS Excel format.
Material Cost Tracking
- History of the changes made in the material cost also recorded
- In various calculations, the material rates used, shall be as per effective from date
- Provision to add / edit backdated cost or rate of each material
Project Delivery
Tracking of delivery as per the planning till receipt of payment is possible.
- Project Delivery stages –
- Planned: Delivery is planned
- Delivered: Delivery process completed
- Accepted: Delivery acknowledgement from Client
- Invoiced: Invoice raised after Delivery acceptance by Client
- Payment received: Payment received from Client against the Invoice
- Delivery tracking of actual dates against planned dates.
- Complete history of each delivery stage is maintained.
- Approval workflow, default unit, currency etc. are configurable.
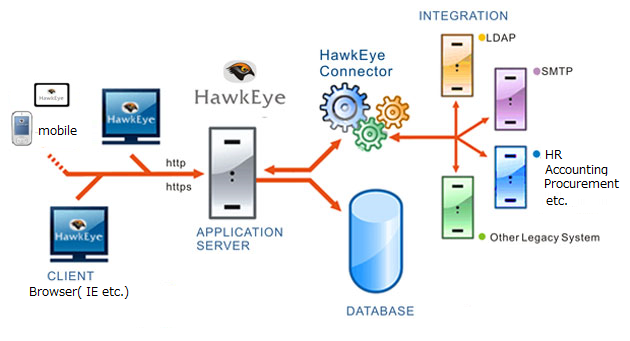
HawkEye Connector(Optional)
Connectivity to legacy systems.
HawkEye Analytics (Optional)
ANALYTICS(分析ツール)
Web based Analytics tool for Project Management MeasuresOLAP interface for analyzing Project Management Measures in HawkEye
Can connect to HawkEye Repository or Live HawkEye database
User defined reports from available dimensions/measures
Powerful visualization with various graph types support (Pie charts, Line trends, Bar graphs)
Statistical analysis and histogram display for predictive analysis
Customization is possible to use tool for doing analytics on any other Database
eGroup Modules (Optional)
- Leave
- Leave approval workflow and reports.
- Attendance
- Importing Time In and Time Out data to get comparative hours against Timesheet hours.
- Objective Monitoring
- Tracking of goals set for human resources during their performance appraisals.
- Facility Management
- Booking of common facilities like conference room, meeting room, training room, car etc.